Push data to widgets
❗ Important: The documentation in this topic refers to a feature or product that is currently in Early Availability status. Features in Early Availability status are only available in production to a limited number of customers based on fit with specific use cases. For more information about Early Availability status, see Product lifecycle phases. If you would like to use the product capabilities described here during the Early Availability phase, contact your AppDirect technical representative.
Our custom data tools are designed to make it incredibly easy for users to connect unique data sources to their dashboards. The Push Data tool is ideal for users that would like to export data from an on-premises server environment or other source that does not make data-sets available to AppInsights’s servers. Using your unique account access key and individual widget stream names, you can populate any AppInsights visualization as long as the corresponding data point or data set is provided in our native format.
Prior to using this walkthrough, you may be interested in reviewing our full API documentation for more context on the technical capabilities of the Push Data tool.
To get started, navigate to the Services pane, select the API Data Widgets tile, and then the “Push Data” option. You will be presented with a list of visualization options to choose from—for this example, let’s use the basic Number widget.
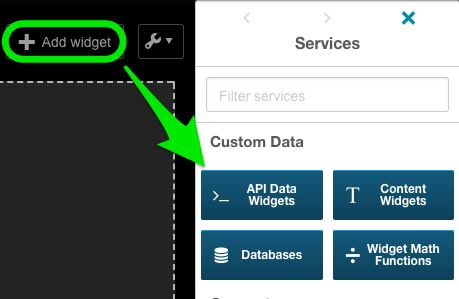
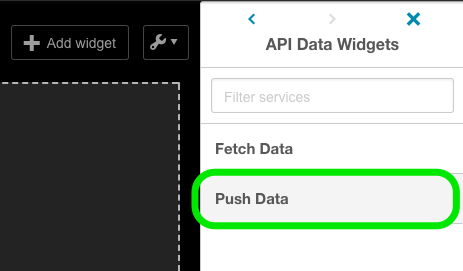
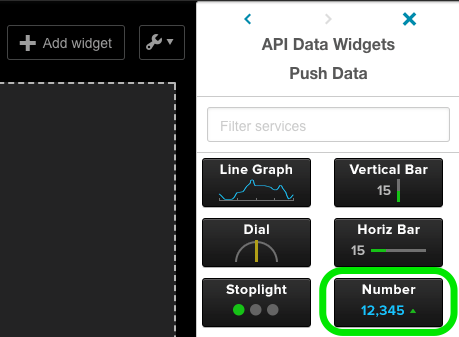
Select your visualization and you will notice that a new widget will appear on your dashboard. Any time a new custom data widget is deployed to the dashboard, it will need to be configured. To get started, click the gear icon and navigate to the “Edit Widget Settings” menu.
From the “Data Settings” tab, confirm the stream name for your widget. You may use the randomly generated stream name, or you can specify a name of your choice but note that you may not use the same stream name for multiple widgets. If you deploy a new custom data widget to the dashboard and do not first confirm the stream name from the “Edit Widget Settings” menu, you will be unable to populate your widget.
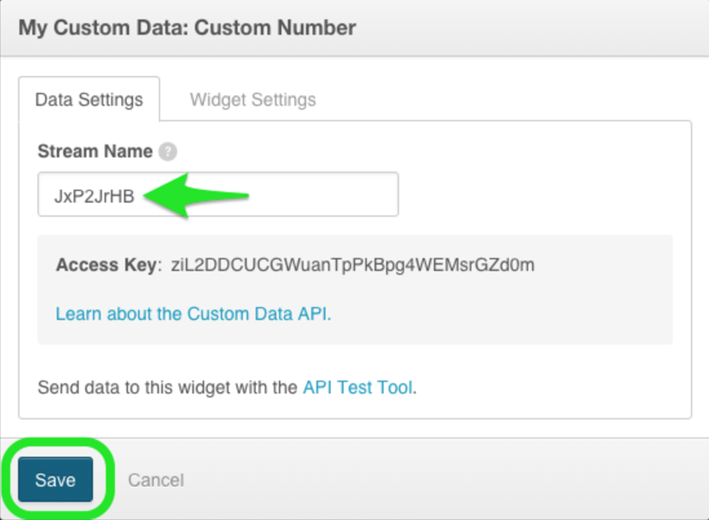
Using a basic curl command, send your “Access Key”—consistent across all dashboards / widgets—as well as your “Stream Name”—unique to each widget—and then structure the rest of your command line to cooperate with the visualization type you have chosen (detailed instructions in our API documentation).
Our sample curl command will surface the number of seconds since the Unix epoch.

curl -X POST \

-d "{\"accessKey\": \"ziL2DDCUCGWuanTpPkBpg4WEMsrGZd0m\", \"streamName\": \"JxP2JrHB\", \"point\": {\"number\": "`date +%s`", \"suffix\":\" seconds\"} }" https://www.leftronic.com/customSend/
A successful run of your command will immediately populate your corresponding AppInsights widget with the data you have generated.
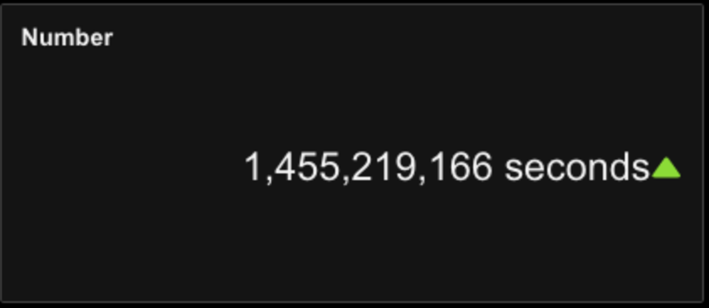
This is one basic example of our Push Data tool in action—we look forward to hearing from you with details on the unique uses you discover!
Was this page helpful?
Tell us more…
Help us improve our content. Responses are anonymous.
Thanks
We appreciate your feedback!